Understand Thermal DeraTIng Aspects of PWM ICs to Ensure the Best System Performance
Abstract: Modern DC-DC converters use PWM controllers with integrated MOSFETs to achieve the highest power density for DC-DC modules. Since the power MOSFETs are inside the PWM chip, they can significantly affect the thermal performance of the device. For opTImal device performance, it is thus criTIcal to establish the thermal-deraTIng aspects of PWM ICs under realistic operating conditions. This article describes how to construct and calibrate a thermal-derating box for evaluating the thermal performance of PWM controllers.
This article was also featured in Maxim's Engineering Journal, vol. 66 (PDF, 3.07MB).
A version of this application note was published in Power Electronics Technology magazine, February 2009.
Introduction
The final operating environment for a chip is often not well known during the IC's evaluation stage, and that environment can vary considerably from application to application. It is especially critical to understand thermal derating in portable and nonportable applications, since end systems often depend on forced airflow for cooling. This is why thermal-derating graphs are included in data sheets for pulse-width-modulated (PWM) controllers with internal MOSFETs. The derating curves show how much power can be drawn from the chip under given airflow and ambient temperature conditions.
To ensure that the application's thermal environment does not overload the PWM controller, a thermal-derating graph can be used to select proper PWM ICs. A test system with a thermal-derating box provides a practical way of evaluating the thermal-derating performance of the PWM chip.
This article describes how to construct and calibrate a thermal-derating box. Test results for two PWM controllers show a close match to actual operating conditions.
Standardizing Thermal Testing
For a given module size (including heatsink) and for a given airflow, the maximum power that can be dissipated is limited by physics. Thermal performance can, therefore, be estimated. However, without some type of standardized control of the IC test environment, the thermal-derating results from different vendors and for different packages will not be consistent.
One approach for generating standard device-derating data is to actually measure the thermal performance of the module under different airflow and ambient temperature conditions. A thermal-derating box will have an evaluation (EV) board with the PWM IC mounted inside the box, and a fan that can be calibrated to obtain uniform airflow. The test results would be published and used by designers as a basis for choosing the right kind of module for the end application.
Test Apparatus and Calibration
A standard thermal-derating box (Figure 1) was created. Box dimensions should be adjusted so that the largest EV board fits inside and sufficient clearance remains around the box. The minimal linear dimensions of the box should be 1ft x 1ft. The height of this test box should be 3in to accommodate a fan. Two or more fans can be used to achieve uniform airflow inside the box. The box material should have low thermal conductivity; polycarbonate, polypropylene, or a glass epoxy sheet can be used. The thickness should be at least 3.2mm to provide rigid sides. 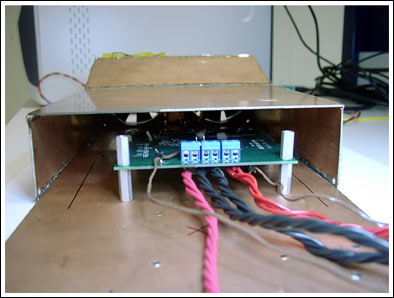
More detailed image (PDF, 5.50MB)
Figure 1. The thermal derating box surrounds the EV board and keeps the airflow predictable to ensure reproducible measurements.
Place the box horizontally inside a thermal chamber. Calibrate the box with an average airflow meter (Figure 2) to measure airflow at the open end of the box at left, center, and right, and to confirm that airflow is uniform inside the box. When a module is placed in the box, make sure that the fan is at least 2in from it. Airflow can be adjusted by using a voltage-controlled variable-speed fan and increasing or decreasing the voltage. 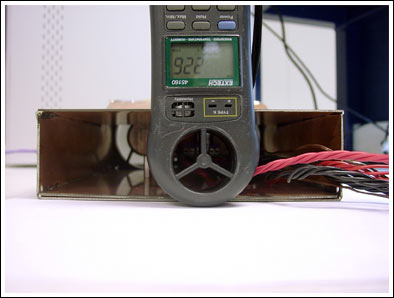
More detailed image (PDF, 4.57MB)
Figure 2. An airflow meter at the open end of the box measures the airflow to calibrate subsequent thermal measurements.
Start with a standard EV board, which can be mounted on a bigger board for convenient handling and placement. Elevate the bigger board at least 1in from the bottom of the box to ensure uniform airflow under the board.
Once the box is inside the oven, you must determine if the oven's airflow will affect the airflow inside the derating box. If the oven's airflow does affect the box's airflow, then place a larger box over the test enclosure to maintain uniform airflow inside the box. To minimize interference, consider mounting the derating box with its fan airflow at a right angle to the oven's airflow.
Common fasteners and adhesives can be used to assemble the box—just make sure that they can withstand higher temperatures in the oven. A thermocouple can be placed at the geometric center of the IC. However, the attachment of the thermocouple to the IC is very critical, since you must be sure that the thermocouple does not act as a heatsink. The best approach is to use a minimal amount of thermal epoxy to attach thermocouple wire to the IC.
The meter measuring the thermocouple output should float electrically so that temperature readings are not affected by any voltage applied to the IC. Thermocouple wire size can be 30 AWG or smaller, and the wires should be routed to minimize interference with the airflow. The same holds true for the power and any other wires coming from the board under test.
Before actual device testing, the thermal-derating box must be calibrated (see Figure 2). Table 1 shows the calibration data for an empty test box, while Table 2 shows data for the test box with the EV board. Data plots are shown in Figures 3a and 3b. For both configurations, almost uniform airflow is measured inside the box.
With the box ready, mount the EV board on the test board and put everything inside the thermal chamber. Run the chamber for some time so that thermal equilibrium is reached. Then the EV board can be loaded and run until temperature readings stabilize. If two readings taken 5 minutes apart do not change more than 0.2°C, then it can be assumed that thermal equilibrium has been reached.
Note, finally, that thermal derating with no airflow is harder to determine since natural convection is unstable, especially at higher IC temperatures and higher power levels.
Table 1. Airflow Calibration Data for the Empty Test Box
| Air Flow (LFM) | |||
| Fan Supply (V) |
Left | Center | Right |
| 3.3 | 102 | 98 | 91 |
| 4 | 215 | 207 | 187 |
| 6 | 339 | 337 | 323 |
| 8 | 449 | 447 | 445 |
| 10 | 565 | 585 | 581 |
| 12 | 685 | 709 | 673 |
Table 2. Airflow Calibration Data for the Test Box with EV Board
| Air Flow (LFM) | |||
| Fan Supply (V) |
Left | Center | Right |
| 3.3 | 91 | 90 | 89 |
| 4 | 189 | 160 | 205 |
| 6 | 333 | 321 | 325 |
| 8 | 455 | 445 | 443 |
| 10 | 561 | 581 | 565 |
| 12 | 673 | 689 | 671 |
Figure 3a. With the test box empty, three airflow measurements provide baseline information.
Figure 3b. With the EV board inserted into the test box, the airflow measurements are repeated to identify differences in the airflow vs. the empty box.
Test Results
To verify the performance of the test box, experiments were done to measure the thermal performance of two Maxim PWM ICs, the MAX15035 and MAX8686. The test results are shown in Figures 4a and 4b, respectively. The MAX15035 is a 15A step-down regulator with internal switches. The MAX8686 is a single/multiphase, step-down, DC-DC converter that can deliver up to 25A per phase. The MAX15035 EV board has four layers measuring 2.4in x 2.4in with 2oz copper, while the MAX8686 EV board contains six layers and measures 3.5in x 3.0in with 2oz copper.
Figure 4a. Maximum output current vs. ambient temperature for the MAX15035. With the MAX15035 EV board in the test box, the thermal derating curves are determined for three different levels of airflow.
Figure 4b. Maximum output current vs. ambient temperature for the MAX8686. The thermal derating graph of the MAX8686 shows that at +50°C ambient the controller can handle its rated 25A current with as little as 100 LFM of airflow.
By capturing this real-world data, designers can more accurately determine the necessary thermal derating for their application. From these thermal-derating graphs, the end user can choose the right part for their application. For a given ambient temperature and airflow, the graph shows how much power can be handled by a PWM IC without exceeding the chip's safe operating region. If a PWM IC does not meet the safe operating criteria for an application, then the user either has to increase the airflow available for cooling or improve the thermal design.