The audio amplifier is generally assumed to be the limiting factor in performance specifications, such as THD+N. However, THD introduced by passive components inline with the signal path can become a significant contributor to system-level distortion measurements. This article will address the limitations introduced by passive components in series with the audio signal path. An emphasis will be made on the analysis of nonideal, Class 2 dielectric, multilayer ceramic capacitors.

免费注册参加在线研讨会,学习如何分析、测量并最终解决音频系统的设计问题 (English only) 。
Introduction
Passive components are critical to a successful audio design. They define the gain, provide biasing, reject power-supply noise, and establish DC-blocking between stages. Unfortunately, the space, height, and cost restrictions typically associated with portable audio devices force the use of passive components with small footprints, low profiles, and low cost. If not fully understood, the nonlinearity associated with these small, low-cost passive components can limit Windows Vista compliance.A given capacitor's deviance from an ideal device can be qualified by several factors: voltage coefficient, temperature coefficient, piezoelectric effect, equivalent series resistance, equivalent series inductance, leakage current, dielectric absorption, and tolerance. Among these various factors, two terms are most important to understand when designing a signal path for premium audio performance: the voltage coefficient and the main contributor to it, the converse piezoelectric effect.
Piezoelectric Effect
Piezoelectric effect is when certain crystals exhibit electrical charges under mechanical loading. The piezoelectric effect originates from the displacement of ionic charges within a crystal structure. In the absence of a mechanical load, the crystal structure is symmetrical and the resulting electric dipole moment is zero. When a mechanical load is applied, the charge distribution is no longer symmetrical and a net polarization is produced.The converse piezoelectric effect is the situation in reverse: a change in the applied electric field results in a change of mechanical dimension. Large K-factor capacitors (i.e., Class 2 dielectrics) have a discernible converse piezoelectric effect in which an applied electric signal results in a change in the capacitor's mechanical dimension. As the amplitude of the applied electric signal increases, the capacitor's physical deformation increases, thus changing the capacitor's rated electrical value. When placed at the input of an audio amplifier to establish DC blocking between the codec and the amplifier, (Figure 1), the capacitor's varying electrical value results in a nonlinear, signal-dependent gain change of the amplifier:
AV = RF/(1/sCIN + RIN)
Intuitively, any nonlinear effect of the capacitor's impedance (1/sCIN) will tend to dominate at low frequencies where the impedance is significant in defining the gain. This phenomenon translates into audio distortion.
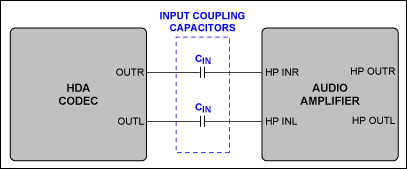
Figure 1. Input coupling capacitors establish DC blocking between the HDA codec and the audio amplifier.
This converse piezoelectric effect is by far the dominant cause of increased distortion at lower audio band frequencies (Figure 2). The effect is maximized when the input coupling capacitor's electrical value equals the input impedance of the audio amplifier (or at f-3dB = 1/(2 πRINCIN). Given the typical values for an audio amplifier's input resistance and an input coupling capacitor, f-3dB is generally placed at or below 100Hz.
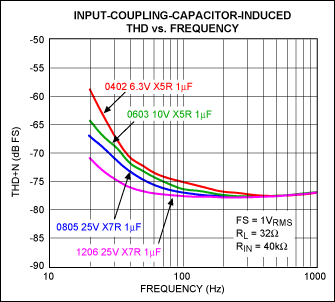
Figure 2. Input-coupling-capacitor-induced THD vs. frequency, FS = full scale.
Converse piezoelectric effect in Class 2 low-dielectric capacitors is the major contributor to voltage coefficient, a term that describes the change in value of a component due to an applied voltage. Interestingly, these capacitors react differently depending on whether a changing (AC) voltage is applied, or a constant (DC) bias is present.
The Effects of Applied DC Voltage
A typical effect of applied DC voltage is illustrated in Figure 3 for various 1µF capacitors, a typical value for AC-coupling amplifier inputs in PC applications. The application of increasingly positive (or negative) DC voltage in Class 2 dielectric materials results in a decrease of a capacitor's electrical value.Note: This article will not attempt to define the mechanics and physics governing this phenomenon. Instead the article simply present measurements of the effect and guides a system designer in selecting capacitor types for optimized PC sound quality.
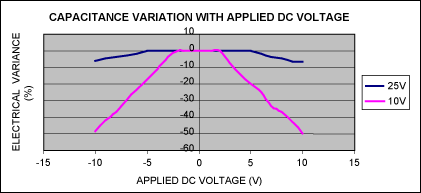
Figure 3. Electrical variance of 1.0µF ±20%, 25V, X7R, 1206 ceramic capacitor and 1.0µF ±20%, 10V, X7R, 0603 ceramic capacitor with applied DC voltage, TA = +25°C.
The Effects of Applied AC Voltage
While the application of increasing DC voltage tends to decrease the capacitance of a Class 2 dielectric, the application of an AC voltage (within a reasonable range) tends to increase the capacitance readings (Figure 4).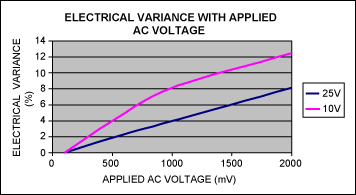
Figure 4. Electrical variance of 1.0µF ±20%, 25V, X7R, 1206 ceramic capacitor and 1.0µF ±20%, 10V, X7R, 0603 ceramic capacitor with applied AC voltage, f-3dB = 100Hz, TA = +25°C.
If a high enough AC voltage is applied, the capacitance will eventually be reduced in the same manner as the DC voltage reduces the capacitance. However, this high voltage level is not representative of normal voltage swings found in a PC audio circuit. Therefore, this voltage level is not included in the analysis above.
The effect illustrated in Figures 3 and 4 above is translated into audio performance in Figure 5.
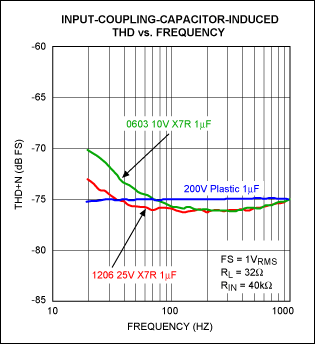
Figure 5. 10V vs. 25V voltage coefficient for 1µF X7R ceramic capacitors, FS = full scale.
Figure 6 shows that the effect of applied voltage is quantified in terms of THD+N, although the measurement is dominated by distortion (not noise) here.
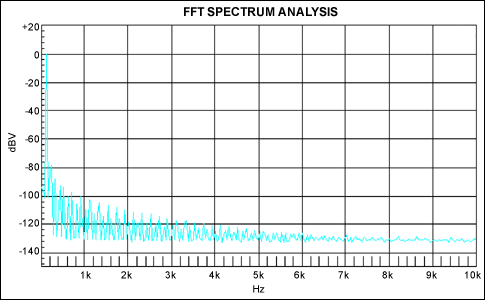
Figure 6. FFT spectrum analysis, FS = 1VRMS, fIN = 100Hz, CDUT = 1µF 25V X7R ceramic capacitor.
A 1.0µF, X7R dielectric, ceramic capacitor was placed in series with a Maxim MAX9789A audio amplifier input whose typical input impedance is 40kΩ. The device under test (CDUT) was varied between a 10V voltage rating (0603 case size) and a 25V voltage rating (1206 case size), as a THD+N Audio Precision (AP) sweep monitored the output distortion at frequencies ≤ 1kHz. Notice the increased distortion in the 10V voltage-rated 1.0µF input coupling capacitor versus the 25V voltage-rated 1.0µF input-coupling capacitor.
A low voltage rating (i.e., a high voltage coefficient) results in THD because the capacitor's electrical value moves around more readily during the sinusoidal cycle. This increased distortion is maximized when the input-coupling capacitor's electrical value equals the input impedance of the audio driver (Figure 7a, Figure 7b).
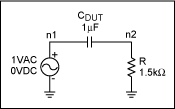
Figure 7a. Simulation schematic.
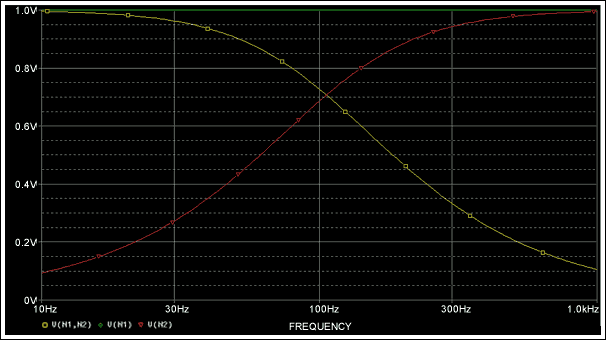
Figure 7b. Voltage across CDUT vs. frequency.
Notice that the voltage across the capacitor, CDUT, is maximized at f-3dB in Figure 7b (V(N1, N2)). The voltage across the capacitor at frequencies less than f-3dB is ignored due to the attenuation of the RC network.
THD in the lower audio frequency band is reduced as the voltage coefficient decreases; the voltage coefficient decreases as the voltage rating increases. In Class 2 dielectrics, selecting a high voltage rating is helpful when attempting to conform to Windows Vista audio specifications. Note, however, that the case size of the capacitor will increase with the voltage rating. A 1.0µF ±20% ceramic capacitor with a 10V voltage rating results in a 0603 case size. In contrast, a 1.0µF ±20% ceramic capacitor with a 25V voltage rating results in a 1206 case size. Regardless of the recent push for ultra-mobile notebook computers and ever-shrinking PC-board area, large-case-size input coupling capacitors are typically required at the headphone amplifier input to meet Windows Vista compliance over the 20Hz to 20kHz bandwidth for THD+N.
Dielectric Type
A capacitor's dielectric type can be regarded as a potential limitation of premium THD performance. Various dielectrics will show different effects in terms of THD. Figure 8 illustrates the DC-bias dependency for Y5V and X7R dielectrics, both with a 16V voltage coefficient and a 0603 case size. The difference in voltage coefficient is now solely due to dielectric material. The X7R dielectric shows a 65% to 70% loss at the rated voltage. The Y5V dielectric exhibits a 70% to 80% loss over the rated voltage range.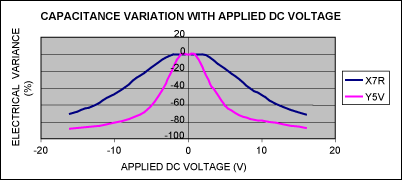
Figure 8. Percentage change in capacitance vs. DC bias voltage for Y5V and X7R 1.0µF ±20% 16V ceramic capacitors in a 0603 case size.
Variance of capacitor due to applied AC voltage is highlighted in Figure 9 for Y5V and X7R dielectrics with a 16V voltage coefficient and a 0603 case size.
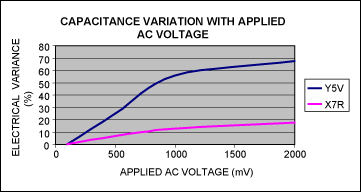
Figure 9. Percentage change in capacitance vs. AC voltage for Y5V and X7R 1.0µF ±20% 16V ceramic capacitors in a 0603 case size.
The effect illustrated in Figures 8 and 9 is translated into audio performance in Figure 10, where the effect of applied voltage is quantified in terms of THD+N. A 1.0µF, 0603 case-size ceramic capacitor with a 16V voltage rating was placed in series with the Maxim MAX9789A audio amplifierinput whose typical input impedance is 40kΩ. CDUT was varied between an X7R dielectric and a Y5V dielectric, as a THD+N Audio Precision (AP) sweep monitored the output distortion at frequencies between 20Hz and 20kHz. Notice the increased distortion at lower frequencies with the Y5V temperature coefficient versus the X7R temperature coefficient. The distortion at higher frequencies (> 1kHz) is limited by the audio amplifier's loop gain. Also notice that the THD+N in Figure 10 begins to roll off above 6kHz. This happens because the AES17 20kHz filtering is set at the analyzer's inputs. AES17 is a standard, 20kHz bandwidth, lowpass filter used for audio measurements; it begins to attenuate harmonics at approximately 6.6kHz.
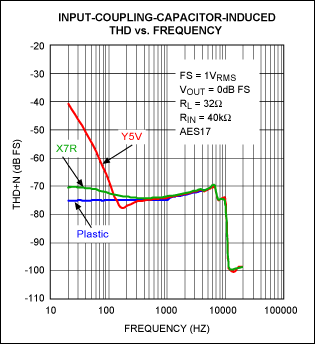
Figure 10. Y5V vs. X7R 1.0µF ±20% 16V 0603 ceramic capacitors.
Summary
When considering capacitors for the audio signal path, select capacitors with X7R dielectrics for better THD performance. X5R dielectrics outperform Y5V dielectrics; however, X7R dielectrics offer the greatest performance amongst Class 2 dielectrics in terms of THD.Conclusion
The space, height, and cost restrictions typically associated with portable consumer electronics force the use of passive components with small footprints, low profiles, and low cost. When used for audio signal coupling, some small-footprint, low-profile, low-cost passive components can limit low frequency THD performance in audio circuits. Audio sound quality is compromised as a result and Windows Vista-compliance is jeopardized. With a slight increase in footprint and minimal price increase, the large-footprint ceramic capacitors with high voltage ratings and X7R dielectrics are recommended for all passive components in the signal path for a Windows Vista-compliant audio design.References
¹Windows Vista Logo Program Device Requirements, Version 3.0, is the authoritative source of information for audio device requirements.
Appendix
Applied DC Test Conditions
To obtain capacitance variation measurements versus applied DC voltage, the CDUT is placed in series with a 1.5kΩ ±1% resistor (Figure 11).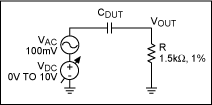
Figure 11. Applied DC test conditions.
CDUT in series with R forms a highpass filter (HPF) so that the capacitor's electrical value can be measured as the applied DC voltage is increased (CDUT = 1/(2π Rf-3dB)). A 100mVRMS AC signal is superimposed on a varying DC voltage source. The f-3dB of the highpass filter is noted at each 1VDC increment (Figure 12). VDC is varied from 0VDC up to the component's voltage rating.
Note that the series resistor, R, must be selected so that R >> the finite source resistance of the audio analyzer. In this case, the Audio Precision (AP) analog generator was selected with a 40Ω source resistance.
Also note that a cut-off frequency of 100Hz was selected for this measurement to highlight the effects of applied DC voltage above and below f-3dB. A 20Hz cutoff frequency was not ideal, as the audio precision only provides measurements down to 10Hz. Windows Vista WLP 3.0 specifies f-3dB at 20Hz.
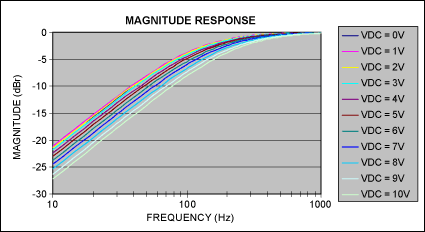
Figure 12. Typical effect of DC applied across capacitive plates, CDUT = 1.0µF ±20% 10V X7R 0603 ceramic capacitor, TA = +25°C.
Given the f-3dB frequency and the known series resistor value (1.5kΩ ±1%), the capacitance of CDUT can be extracted (Table A).
Table A. Measured Capacitance Variation with Applied DC Voltage,
Nominal CDUT = 1.0 ± 20%, 10V, X7R, 0603 Ceramic Capacitor
(V)
(Hz)
(µF)
(%)
Applied AC Test Conditions
To obtain capacitance variation measurements versus applied AC voltage, CDUT is placed in series with a 1.5kΩ ±1% resistor (Figure 13).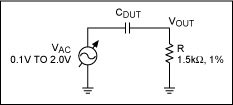
Figure 13. Applied AC test conditions.
CDUT in series with R forms a highpass filter (HPF) so that the capacitor's electrical value can be measured as the applied AC voltage is increased (CDUT = 1/(2πRf-3dB)). The f-3dB point is recorded as VAC is varied from 100mVRMS up to 2VRMS. (2VRMS is the defined full-scale signal from a CD player.)
Given the -3dB cutoff frequency and the known series resistor value (1.5kΩ ±1%, the electrical value of CDUT can be extracted in the same manner as the electrical value was extracted in the applied DC measurements (Table A).
A similar article appeared in the online edition of EDN Magazine in April 2007.
Windows is a registered trademark of Microsoft Corp.
Windows Vista is a registered trademark of Microsoft Corp.