|
|
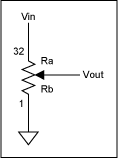
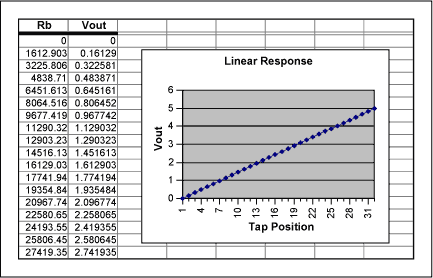
Typical divider configurations are shown in Figures 1, 2, and 3. For each of these circuits assume that Vin represents a low-impedance voltage source and Vout represents a high-impedance input node. Figure 1 depicts a simple voltage divider with a transfer function of Vout = Vin(Rb/Rpot), where Rpot = Ra + Rb, and Ra and Rb represent the resistances from Vin to the wiper and from the wiper to ground, respectively. Stepping the wiper from the bottom of the pot to the top with Vin at a constant 5V level generates a linear transfer function, as shown in the graph on the Linear Response spreadsheet.
Excel spreadsheet for Linear Response (ZIP, 8K)
Figure 1. Linear response circuit and spreadsheet.
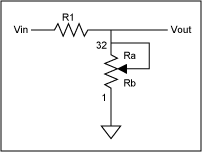
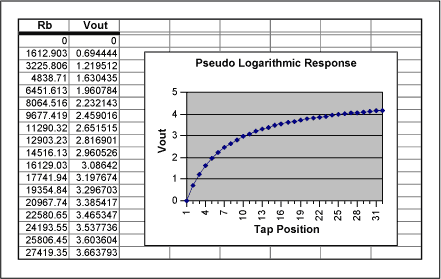
Adding a series resistor to the circuit (R1 in Figure 2) yields an entirely different result. This circuit's transfer function more closely resembles a logarithmic curve and is characterized by the equation Vout = Vin(Rb/(R1 + Rb)). By varying the value of R1, which in this case is 10KΩ, the "pseudo-logarithmic" transfer function can be customized to meet the actual needs of the circuit. A graph of the transfer function is shown below in the Pseudo-Logarithmic Response spreadsheet. One possible drawback to this circuit as compared to a log-taper digital pot is that Vout can only approach the full-scale value of Vin - it cannot reach it. Therefore, there is some loss of the output's dynamic range; the magnitude of that loss depends on the value chosen for R1. Using a log-taper digital potentiometer, however, limits the response to that particular potentiometer's specifications (i.e., 1dB/step, 2dB/step, etc). There are arguments pro and con for both topologies depending on the specifications needed.
Excel spreadsheet for Pseudo Logarithmic Response (ZIP, 8K)
Figure 2. Pseudo logarithmic response circuit and spreadsheet.
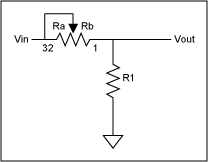
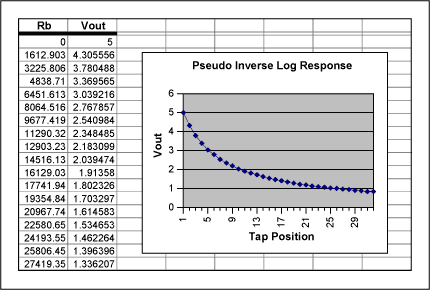
Lastly, swapping the positions of R1 and the MAX5160 yields the circuit shown in Figure 3. This configuration alters the response of the output to form more of an inverse-logarithmic function. The transfer function for this circuit is given as Vout = Vin(R1/(R1 + Rb)) and is shown in the graph within the Pseudo Inverse-Log Response spreadsheet. Again, as in the previous example, the value chosen for R1 affects the dynamic range of the output. This circuit's output does not extend to the ground rail.
Excel spreadsheet for Pseudo Inverse Log Response (ZIP, 8K)
Figure 3. Pseudo inverse-logarithmic response circuit and spreadsheet.
For simple applications, such as the examples given, any of the previous spreadsheets can be adapted to cover a wide range of digital potentiometers and circuit values by following these steps:
1. Double click on the spreadsheet, not on the graph. You may have to close the Chart Toolbar if it pops up.
2. Enter the value of Vin in cell A3.
3. Enter the value of R1 in cell B3.
4. Enter the value of the potentiometer resistance in cell C3.
5. Enter the total number of steps provided by the potentiometer in cell D3.
6. Copy the formulas found in row 34 of columns E, F, G, and H down their respective columns until the number of steps in column E equals the total number of steps provided by the potentiometer (and entered in cell D3). In other words, for a 64-step pot copy the E34, F34, G34, and H34 formulas down their respective columns to row 66.
7. Locate the graph within the spreadsheet. Single click on the graph and the word "Chart" will appear in the menu above the toolbar at the top of the screen. If a separate Chart Toolbar pops up on the screen, close it. Click on the word "Chart" at the top of the screen. From the pull-down menu click on "Source Data." A separate window will appear with the data range of cells highlighted. Now click and drag the pointer down column H (Vout) of the spreadsheet until the cells of interest are outlined. Then click OK in the Source Data window. The graph now depicts the new Vout versus tap-position data.
The examples given are fairly generic in their scope and have not included such parameters as wiper resistance, zero and full-scale error, end-to-end resistance tolerance, temperature coefficients, etc., but with some work the spreadsheets could be modified to include these specifications.